
Keepa is a powerful Chrome Extension tool that can be a valuable asset for those involved in an Online Arbitrage Amazon FBA business. Here are some of the key benefits and features of Keepa:
Price Tracking: Keepa allows users to track price changes of products over time. With this feature, you can easily spot price trends and fluctuations, and make informed decisions about when to buy and sell.
Product History: Keepa can also show you a detailed product history, including information on sales rank, pricing history, and reviews. This information can help you make informed decisions about which products to source and which to avoid.
Competitor Analysis: Keepa also provides valuable insights into competitor activity, allowing you to stay up-to-date on price changes, stock levels, and other important data. This can help you make strategic decisions about pricing and inventory management.
Deal Alerts: Keepa can also send you alerts when products you are interested in drop in price or meet other criteria you have set. This can help you take advantage of time-limited opportunities and stay ahead of the competition.
Comprehensive Data: Keepa provides a wealth of data and insights on millions of products across multiple Amazon marketplaces. With Keepa, you can easily find profitable products and stay up-to-date on market trends.
User-Friendly Interface: Keepa is user-friendly and easy to navigate, with clear graphs and charts that make it easy to understand complex data.
The Keepa Graph
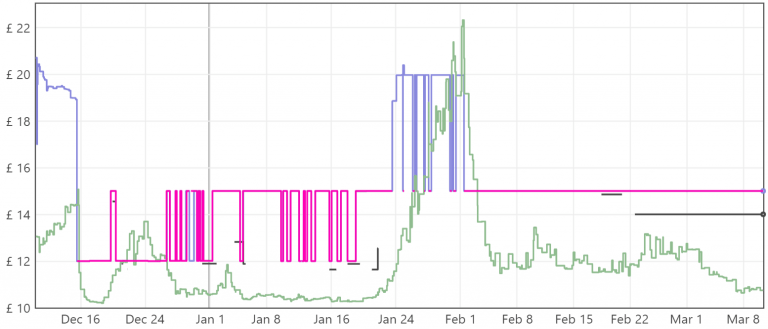
The Keepa graph can be used to estimate a product’s sales volume, although it should be noted that Keepa does not provide exact sales data, but rather estimates based on factors such as sales rank and price.
Here are the steps to estimate a product’s sales volume using the Keepa graph:
-
Look for products with consistent and low sales rank: One of the key indicators of a product’s sales volume is its sales rank. A product with a consistently low sales rank is likely selling well. Look for products that have a low and consistent sales rank over a period of time, as this indicates consistent sales volume.
-
Look for patterns in the price history: Products with a consistent sales volume tend to have a consistent price. Look for patterns in the price history, such as a consistent price or a consistent price range, as this can indicate consistent sales volume.
-
Look for spikes in sales rank: If the sales rank of a product spikes for a short period of time, it can indicate a surge in sales volume. This can be caused by a variety of factors, such as a promotion or advertising campaign.
-
Consider the product category: The sales volume of a product can vary widely depending on the category. Consider the category of the product and compare it to other similar products to get an idea of the potential sales volume.
-
Use the Keepa graph data to make an informed estimate: Once you have looked at the sales rank, price history, spikes in sales rank, and product category, use the data to make an informed estimate of the product’s sales volume.
It is important to remember that Keepa’s estimates are not exact, but can be a valuable tool for estimating sales volume and making informed decisions about buying and selling products.
We would strongly recommend paying for the monthly Premium Data as this gives you access to the most important features of Keepa.
Overall, the Keepa graph is an incredibly powerful tool for analyzing the pricing history of a product and making informed decisions about when to buy and sell. The color-coded design, sales rank history, and ability to set price alerts make it easy to understand and use.